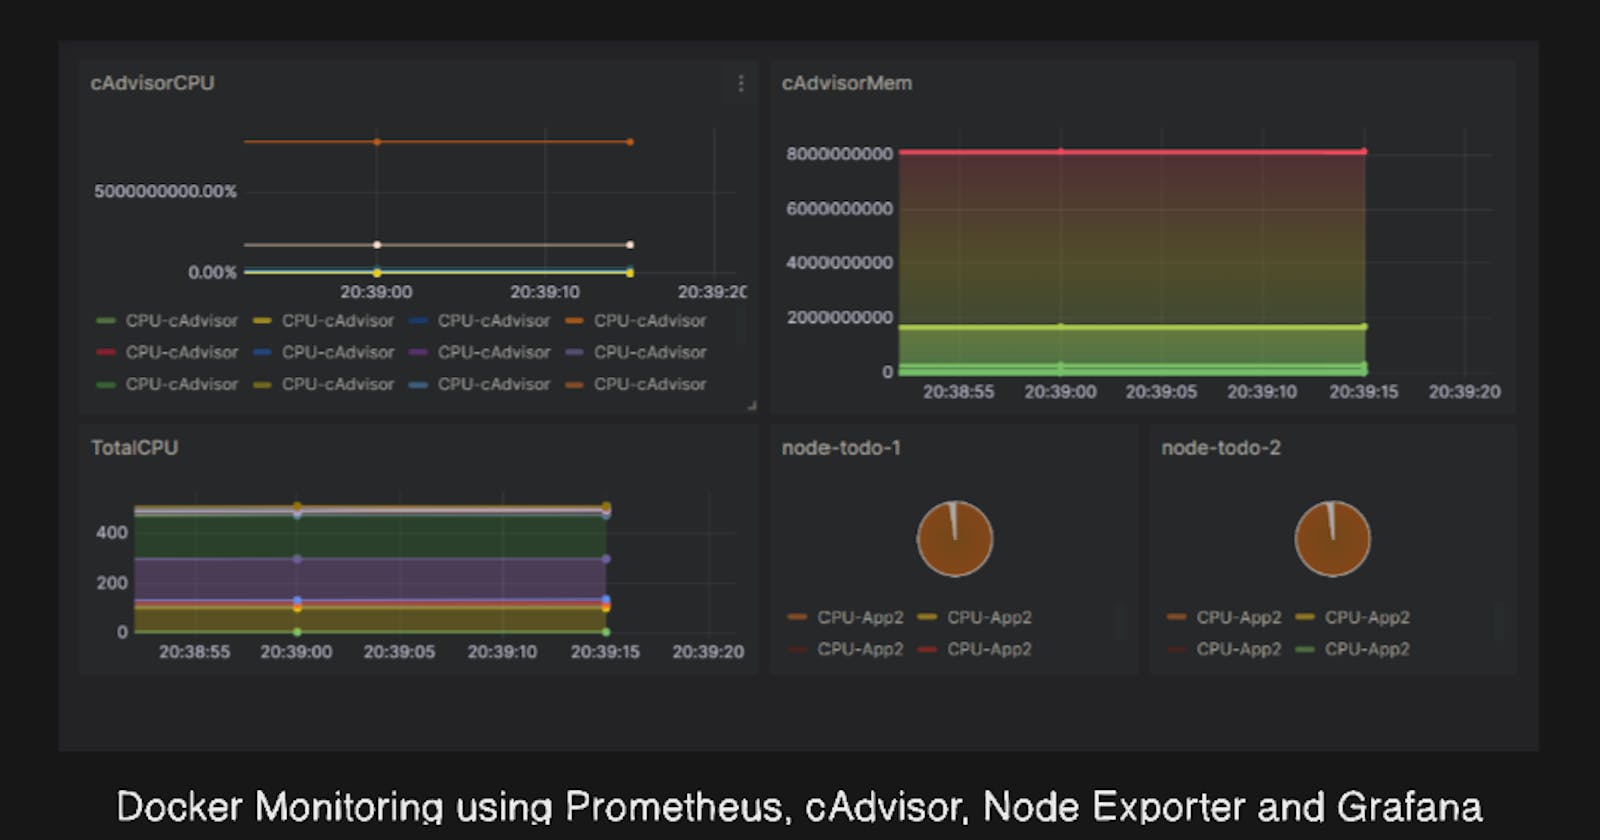
Docker Monitoring using Prometheus, cAdvisor, Node Exporter and Grafana
#Day80 of #90DaysOfDevOps
Table of contents
- Introduction:)
- Prerequisites:
- Step to monitoring containers
- Conclusion:)
- Connect with me:)
Introduction:)
Today, we embark on a hands-on journey into the realm of Prometheus, focusing on the creation of a comprehensive Docker monitoring dashboard.

Prerequisites:

Before we dive into the world of container monitoring, let's ensure we have the necessary prerequisites in place.
A EC2 Linux server running Docker with latest version of Docker Compose
Ports 9090, 9100 and 3000 accessible from monitoring tools
Basic Linux administration and Docker familiarity
Step to monitoring containers

1. Grafana Installation:
Install Grafana on EC2: Follow the official Grafana installation guide to set up Grafana on your EC2 instance. Also, You can find the guide here.
-
2. Docker and Docker-Compose:
Docker Installation: Install Docker on your EC2 instance by following the official Docker installation guide for Amazon Linux.
Docker-Compose Installation: Install Docker-Compose using the following commands:
  sudo curl -L "https://github.com/docker/compose/releases/latest/download/docker-compose-$(uname -s)-$(uname -m)" -o /usr/local/bin/docker-compose
  sudo chmod +x /usr/local/bin/docker-compose
  docker-compose --version
3. Prometheus, cAdvisor, and Node Exporter:
Docker-Compose File: Create a
docker-compose.ymlfile with configurations for Prometheus, cAdvisor, and Node Exporter.Prometheus Configuration: Create a Prometheus configuration file (
prometheus.yml) to specify scraping targets, including cAdvisor and Node Exporter.-
4. Node Exporter Installation:
Node Exporter Download: Download Node Exporter using the following command:
wget https://github.com/prometheus/node_exporter/releases/download/v1.0.1/node_exporter-1.0.1.linux-amd64.tar.gzNode Exporter Setup: Unzip the downloaded file and run Node Exporter to start collecting system metrics.
  tar xvfz node_exporter-1.0.1.linux-amd64.tar.gz
  cd node_exporter-1.0.1.linux-amd64
  ./node_exporter &
5: Create Docker Containers with a Todo App
Step 1: Pull the Docker image from your Docker Hub repository
docker pull simbaa815/node-todo


Step 2: Create a Docker network
Create a Docker network to facilitate communication between containers. You can use the following command:
docker network create todo-net
Using a Docker network is not strictly required, but it is a good practice for creating isolated communication channels between containers.
Step 3: Run two containers
Run two containers with a basic todo app, each connected to the previously created network.
  docker run -d --network todo-net --name todo-app-1 your-todo-image
  docker run -d --network todo-net --name todo-app-2 your-todo-image
You can check the running containers using:
docker ps
6. Integrate Prometheus with Grafana server
Step 1: Access Grafana
Login to the Grafana web console using your browser. The default address is usually http://your_server_ip:3000. Log in with your Grafana credentials.


Step 2: Add Prometheus as a Data Source
In Grafana, navigate to the gear icon ( ☰ ) on the left sidebar and click on "Data Sources."

Click on the "Add your data source" or the "Add data source" button.

Choose "Prometheus" from the list of available data sources.

Configure the Prometheus data source:
Name: Provide a name for the data source (e.g., Prometheus).

HTTP: Set the URL to the Prometheus server (e.g.,
http://your_prometheus_server_ip:9090).
Scroll down and click on "Save & Test" to verify the connection. If the connection is successful, Grafana will display a green "Data source is working" message.

6: Create Dashboards and Visualizations
In Grafana, go to the "+" icon on the left sidebar and select "Dashboard."

Click on "Add new panel" to create a new visualization.


In the panel settings, choose the "Prometheus" data source you just added.

Enter a Prometheus query to retrieve the desired metrics. You can use the Prometheus Query Editor to build your queries.

Customize the visualization settings, such as axes, legends, and visualization type.
Click on "Apply" to save the panel settings.

Conclusion:)
In conclusion, our monitoring journey has been a success. We've established a robust infrastructure, integrating Grafana, Docker, Docker-Compose, and Prometheus to monitor our Docker containers effectively.

Connect with me:)
Thank you for diving into this blog with me! I trust you found the information both helpful and enlightening. To stay updated on the latest in DevOps 🚀, make sure to follow me. Remember, staying informed means staying ahead in the dynamic world of DevOps!
Feel free to connect with me on:
For more updates and engaging discussions on DevOps, let's connect! 🚀 #DevOpsCommunity

