Simplified Setup: Prometheus, cAdvisor, redis and Node Exporter
#Day79 of #90DaysOfDevOps


Introduction:)

In today's journey, we're delving into the realm of Prometheus, cAdvisor, and Redis, powerful tools that orchestrate a symphony of monitoring in containerized environments. Prometheus, known for its prowess in collecting and analyzing metrics, teams up with cAdvisor, the Container Advisor, and Redis, the in-memory data powerhouse. We assume you've got a fair grasp of what Prometheus brings to the table, so buckle up as we explore the installation of these monitoring titans and unlock their potential.
cAdvisor

cAdvisor, which stands for Container Advisor, is an open-source tool designed for monitoring containers. It provides container users with an understanding of the resource usage and performance characteristics of their running containers. cAdvisor operates at the container level, collecting, aggregating, processing, and exporting information about running containers.
Here are the key functionalities and work of cAdvisor:
Resource Usage Metrics:
- cAdvisor collects data on resource usage metrics such as CPU, memory, file system, and network usage for each container. This information helps users understand how containers utilize resources.
Performance Statistics:
- In addition to resource usage, cAdvisor provides performance statistics for individual containers. This includes metrics related to CPU and memory performance, allowing users to assess the efficiency of containerized applications.
Real-time Monitoring:
- cAdvisor operates in real-time, continuously monitoring containers and updating metrics at regular intervals. This real-time monitoring capability enables users to have a dynamic view of container behavior.
Data Export:
- cAdvisor exports collected metrics in a format that is compatible with various monitoring and visualization tools. It can integrate with systems like Prometheus for further analysis and Grafana for creating dashboards.
Container Filesystem Information:
- cAdvisor gathers information about the container's filesystem, helping users understand how much storage is being used, which is crucial for managing containerized applications.
Network Usage Information:
- cAdvisor provides insights into the network usage of containers, including data sent and received. This is valuable for understanding the communication patterns between containers.
Compatibility with Docker:
- cAdvisor is specifically designed to work with Docker containers. It is often used alongside container orchestration systems like Kubernetes to monitor containers in a clustered environment.
Ease of Integration:
- Due to its lightweight nature and compatibility with container runtimes, cAdvisor is easy to integrate into containerized environments without significant overhead.
Redis

Redis is an in-memory data structure store that serves as a versatile and high-performance key-value database. Its primary purpose is to provide a fast and efficient way to store and retrieve data, making it suitable for various use cases.
Here are some key aspects of Redis's work:
In-Memory Data Storage:
- Redis stores data in memory, providing fast read and write operations. This makes it ideal for use cases where low-latency access to data is critical.
Key-Value Storage:
- Redis uses a simple key-value data model. Each piece of data is associated with a unique key, allowing developers to easily store and retrieve information.
Data Types:
- Redis supports various data types beyond simple strings, including lists, sets, hashes, and more. This flexibility allows developers to choose the most suitable data structure for their specific needs.
Caching:
- One of the common use cases for Redis is caching. By storing frequently accessed data in memory, Redis can significantly reduce the response time of applications, especially when dealing with read-heavy workloads.
Installation:)
we install Prometheus, cAdvisor, redis using the docker-compose
Step 1: Prerequisites
Ensure you have the following prerequisites in place:
EC2 instance with Docker and Docker-Compose installed.
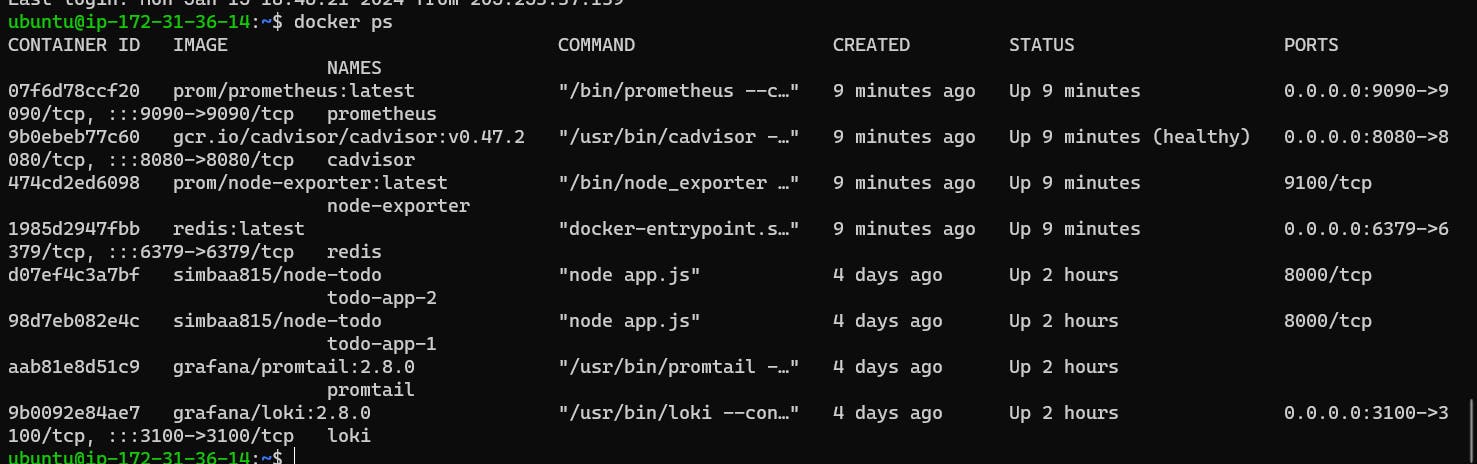
Running containers on the EC2 instance.
Grafana installed on the EC2 instance.
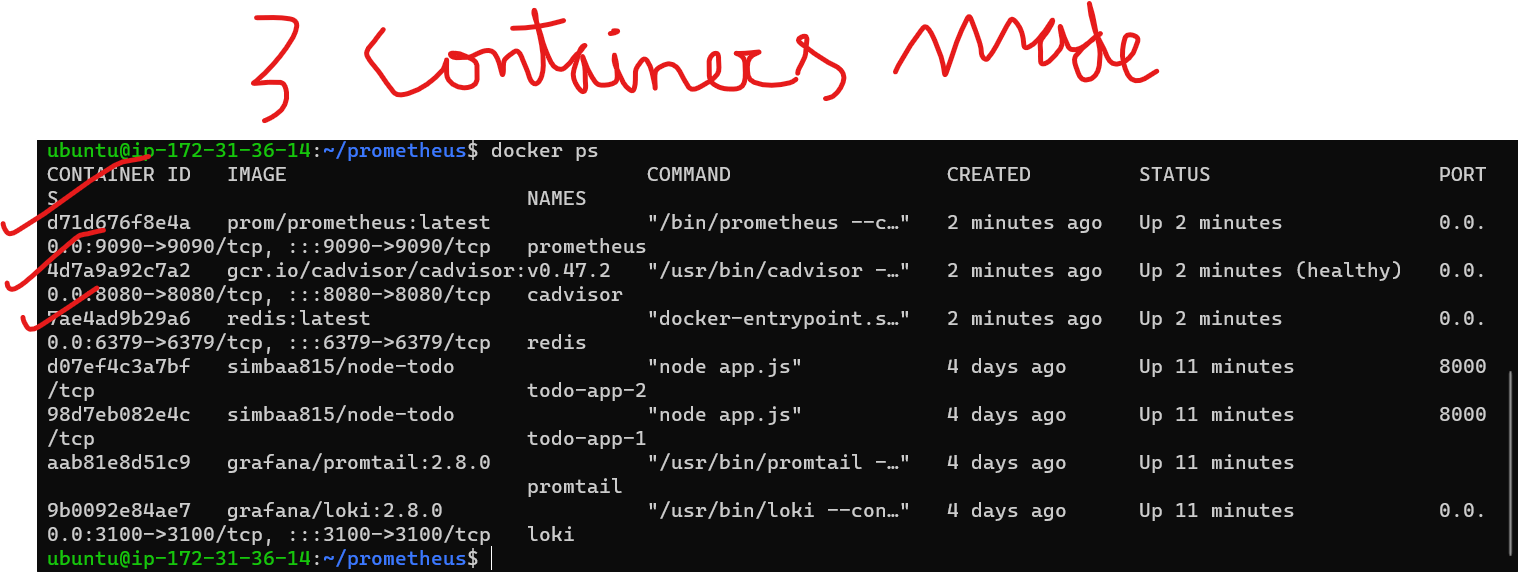
Step 2: Run Docker Containers for Prometheus and cAdvisor
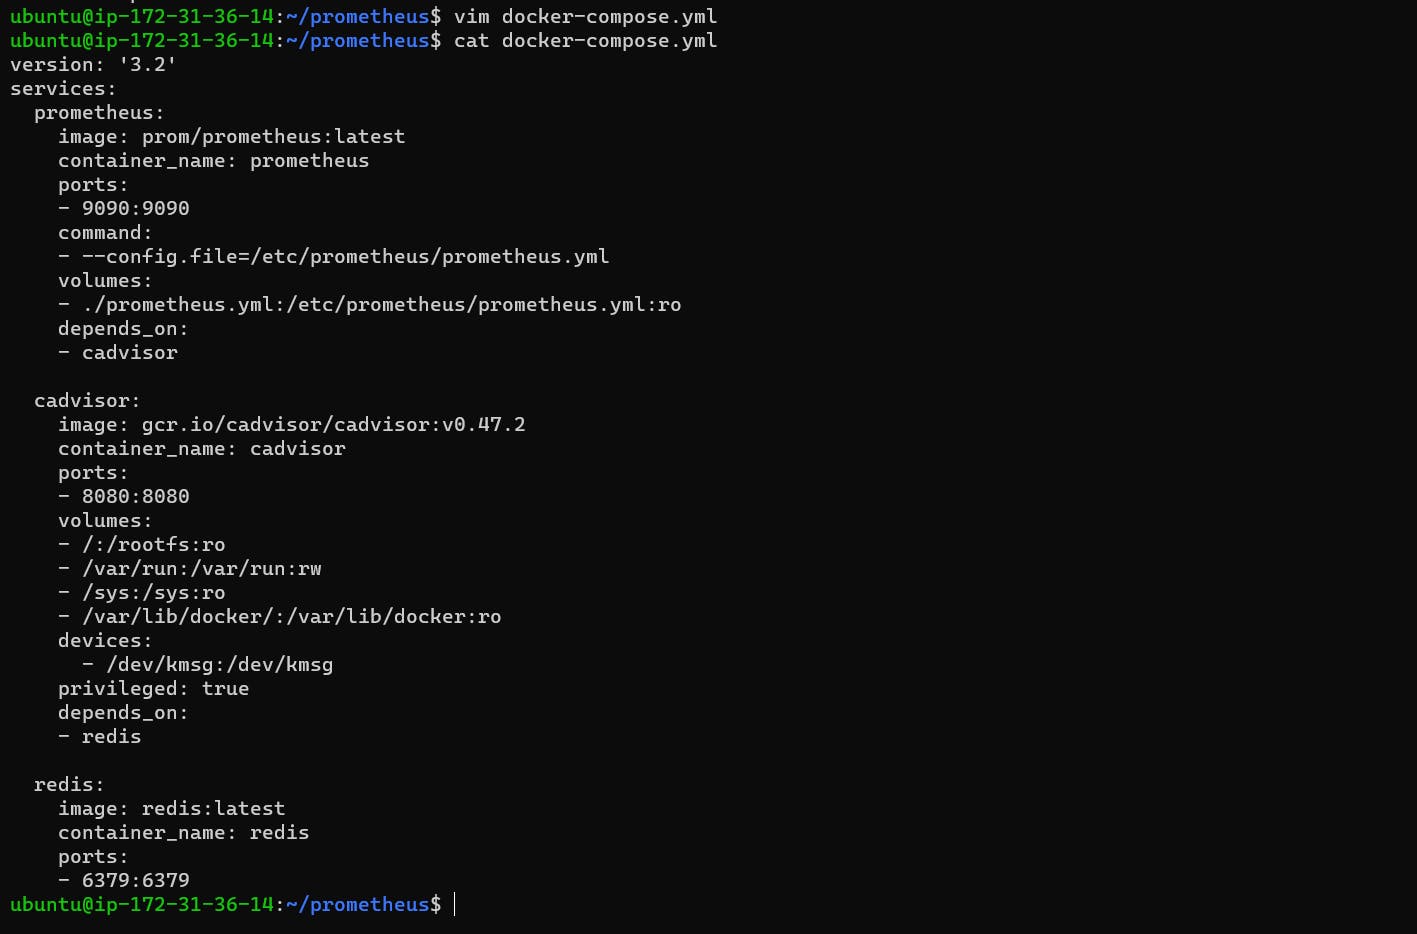
Create a
docker-compose.ymlfile:make sure you also install docker compose
If not simply paste below command
sudo curl -L "https://github.com/docker/compose/releases/latest/download/docker-compose-$(uname -s)-$(uname -m)" -o /usr/local/bin/docker-compose sudo chmod +x /usr/local/bin/docker-composedocker-compose --version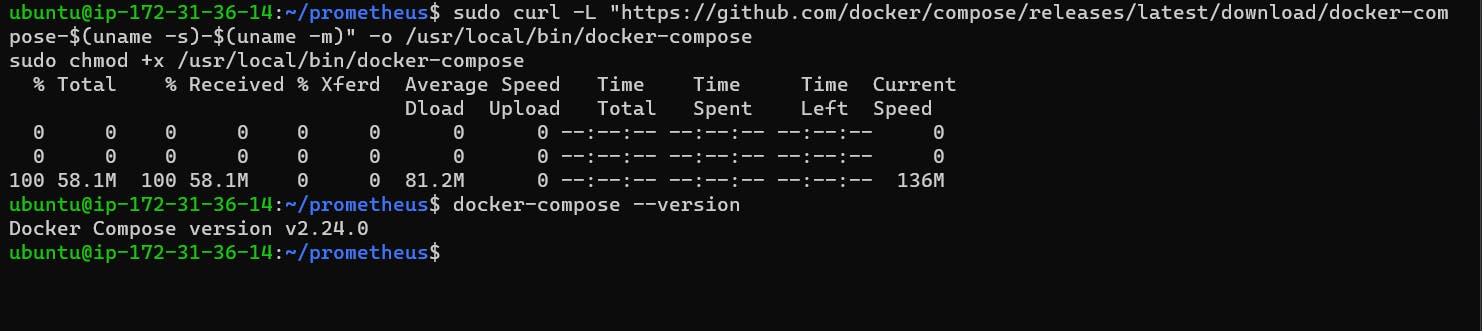
version: '3.2'
services:
  prometheus:
    image: prom/prometheus:latest
    container_name: prometheus
    ports:
    - 9090:9090
    command:
    - --config.file=/etc/prometheus/prometheus.yml
    volumes:
    - ./prometheus.yml:/etc/prometheus/prometheus.yml:ro
    depends_on:
    - cadvisor

  cadvisor:
    image: gcr.io/cadvisor/cadvisor:v0.47.2
    container_name: cadvisor
    ports:
    - 8080:8080
    volumes:
    - /:/rootfs:ro
    - /var/run:/var/run:rw
    - /sys:/sys:ro
    - /var/lib/docker/:/var/lib/docker:ro
    devices:
      - /dev/kmsg:/dev/kmsg
    privileged: true
    depends_on:
    - redis

  redis:
    image: redis:latest
    container_name: redis
    ports:
    - 6379:6379
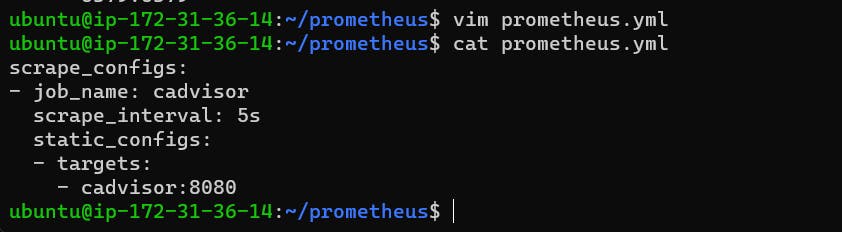
- Create a configuration file for Prometheus (
prometheus.yml):
scrape_configs:
- job_name: cadvisor
  scrape_interval: 5s
  static_configs:
  - targets:
    - cadvisor:8080
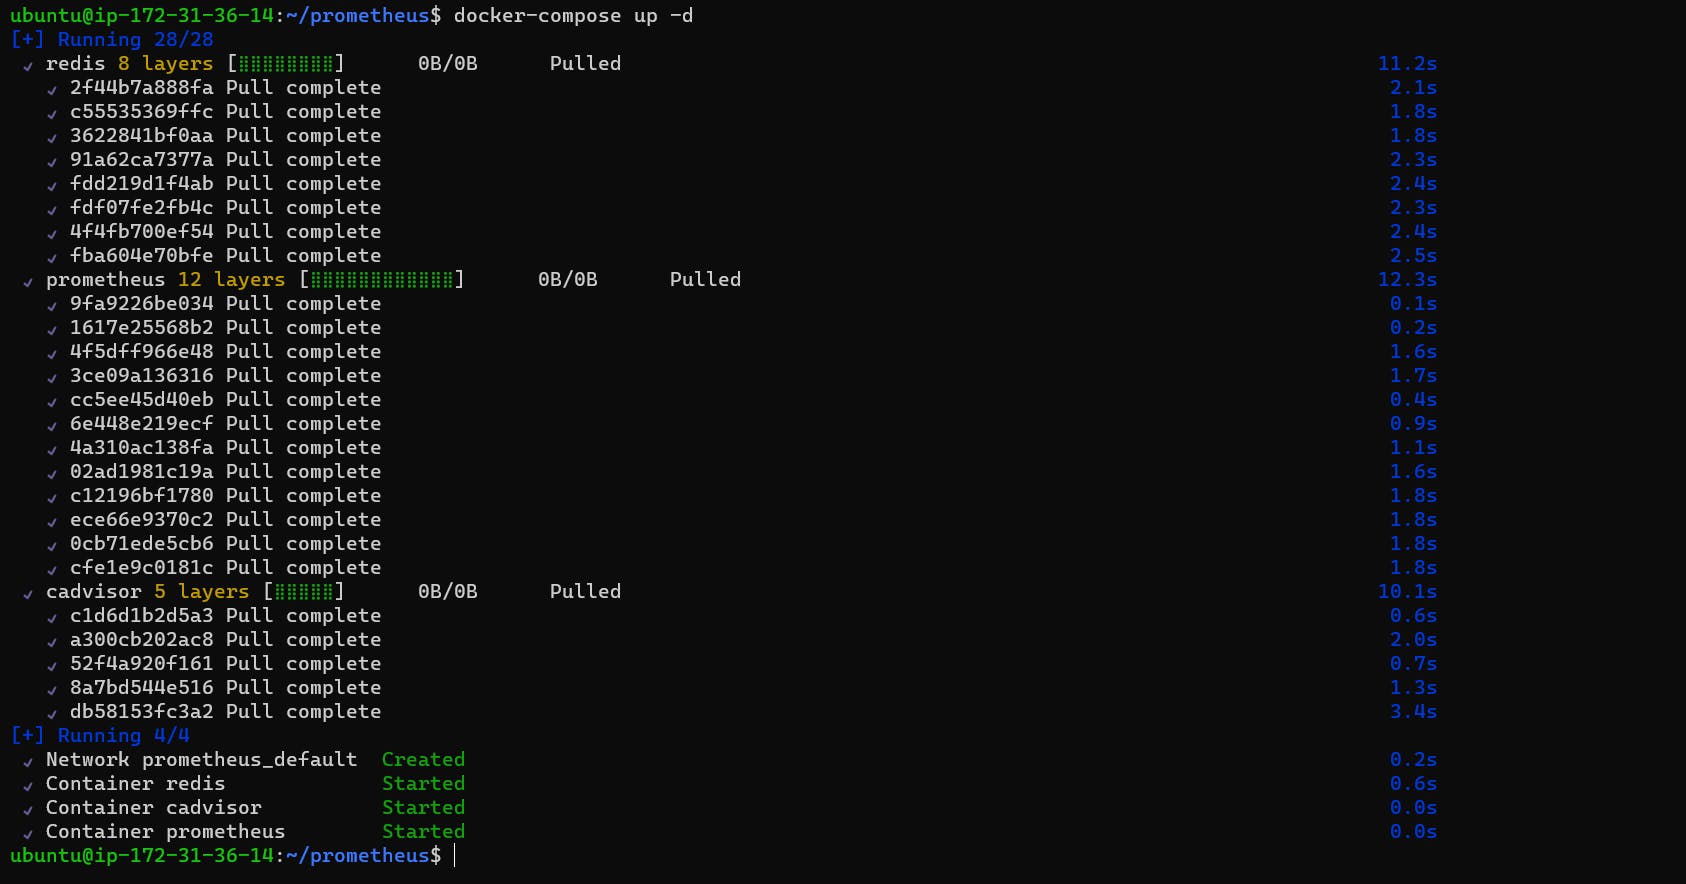
- Run the containers:
docker-compose up -d
Step 3: Expose cAdvisor and Prometheus
Allow ports 9090 (Prometheus) and 8080 (cAdvisor) in the Security Group.
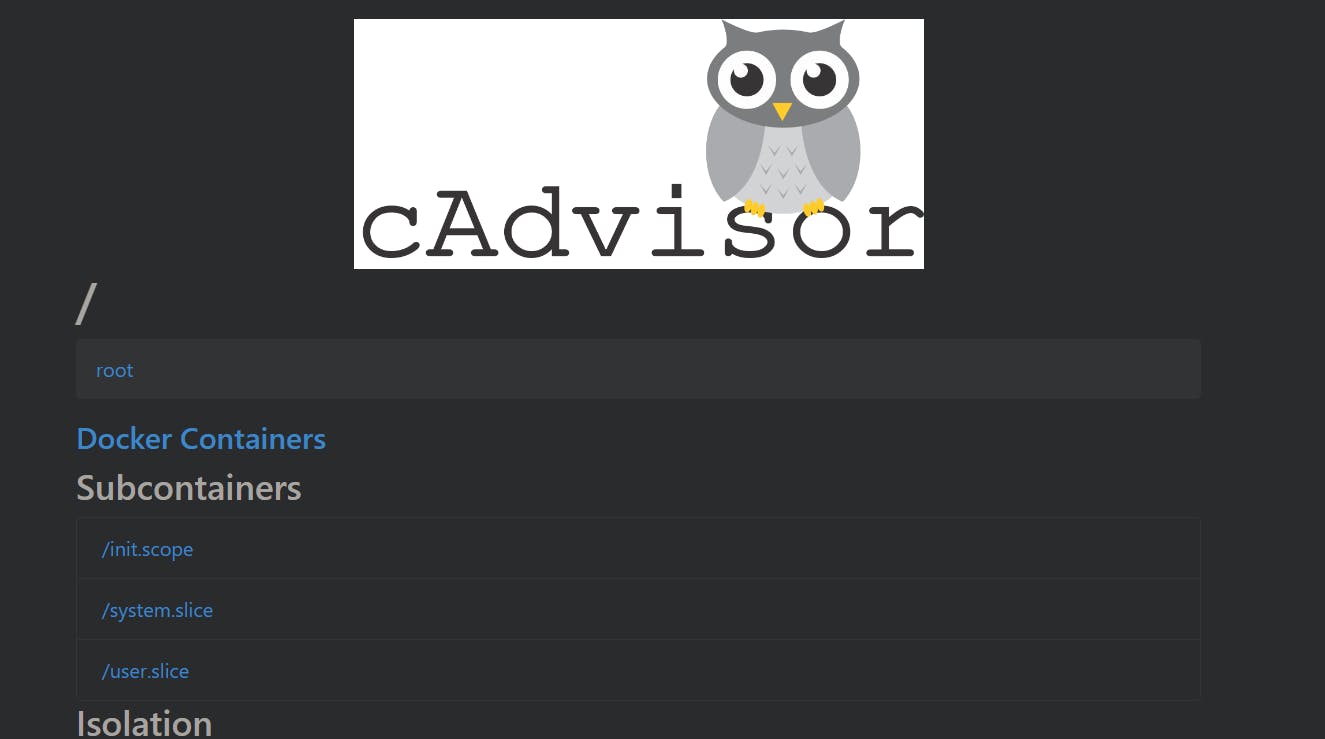
Access cAdvisor web console:
http://publicIP:8080
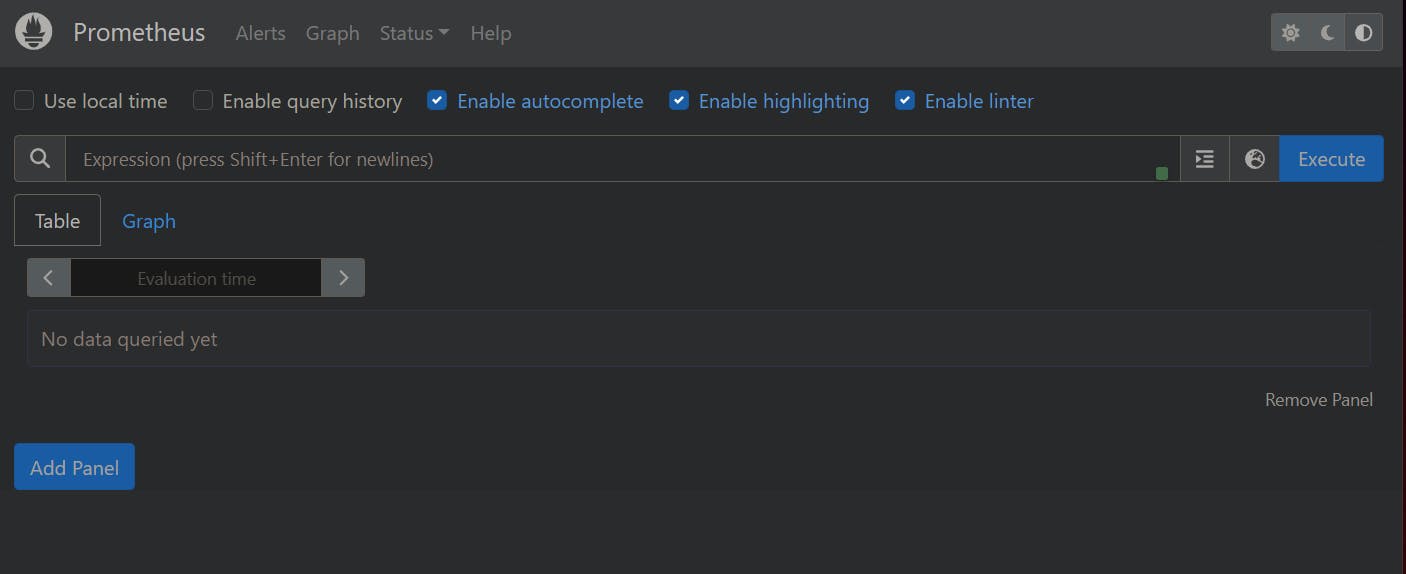
- Access Prometheus web UI:
http://publicIP:9090
Node Exporter

Node Exporter is like a health monitor for your server. 🩺🖥️ It collects crucial information about your system's health, like CPU usage, memory stats, disk space, and more. 📊 This data is then made accessible to tools like Prometheus, helping you keep a close eye on your server's performance. 🚀 So, Node Exporter acts as a friendly doctor, keeping your server in tip-top shape!
Node Exporter setup:
Step 1: Download Node Exporter
Use the following command to download Node Exporter:
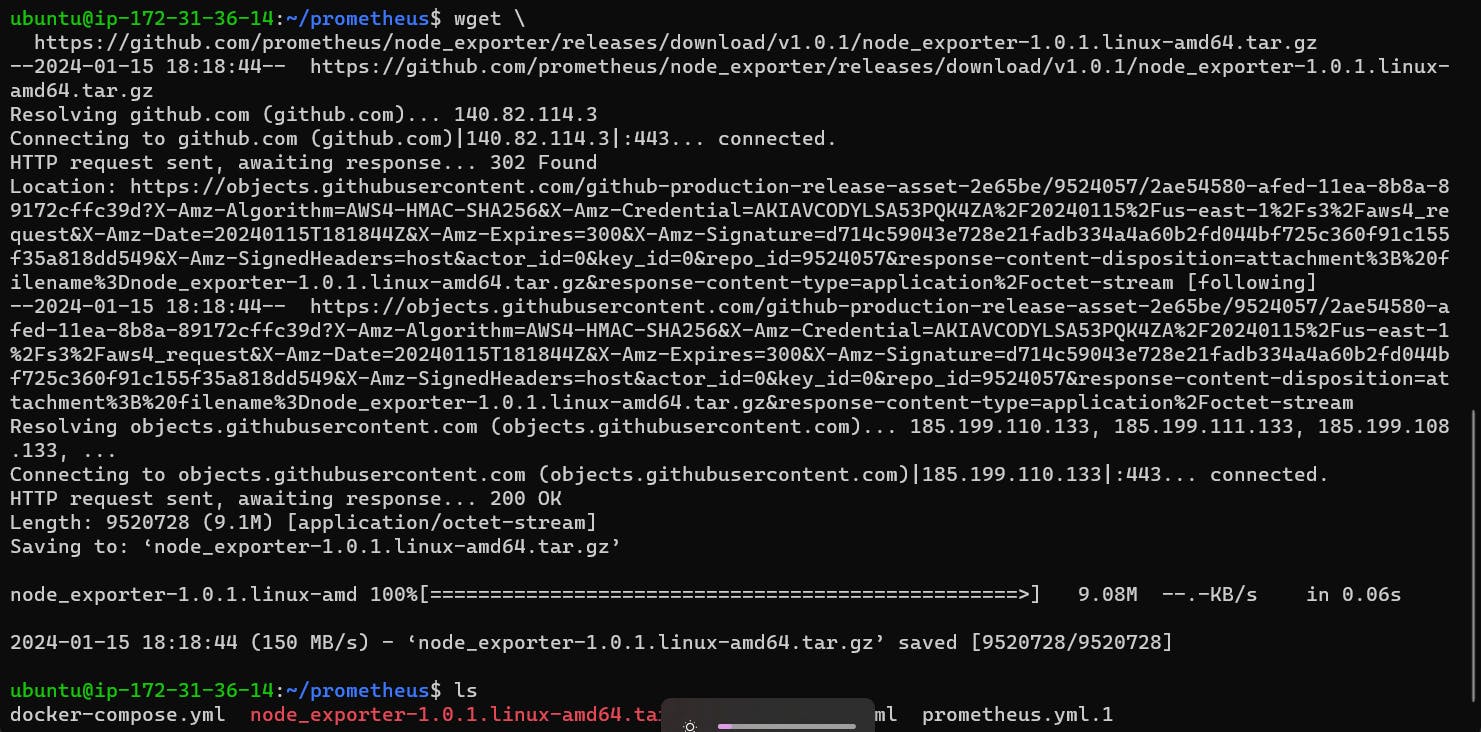
wget \
  https://github.com/prometheus/node_exporter/releases/download/v1.0.1/node_exporter-1.0.1.linux-amd64.tar.gz
Step 2: Unzip the Downloaded File
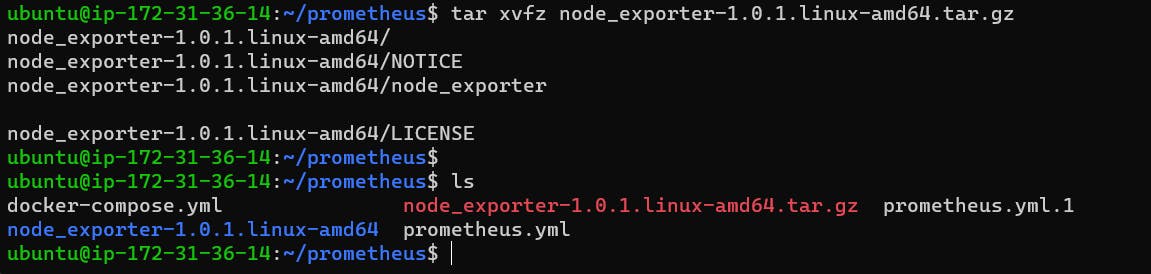
Unzip the downloaded tar.gz file with the command:
tar xvfz node_exporter-1.0.1.linux-amd64.tar.gz
Step 3: Access the Node Exporter Directory
Navigate to the extracted directory:
cd node_exporter-1.0.1.linux-amd64
Step 4: Run Node Exporter
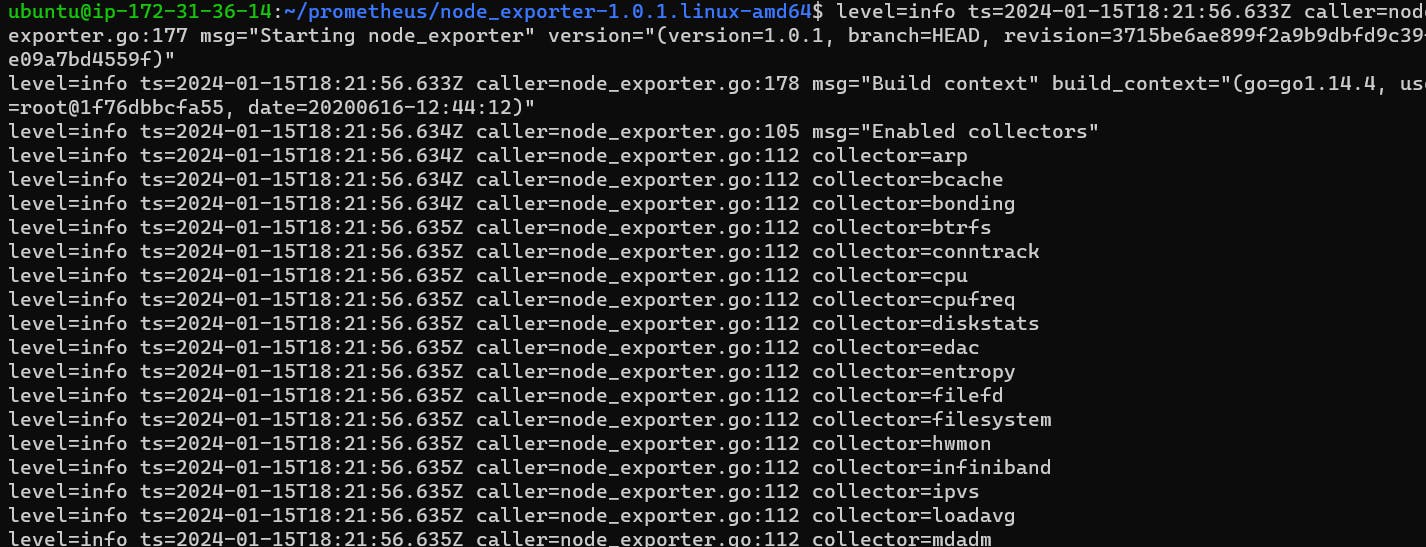
Execute the Node Exporter binary to start collecting and exposing system metrics:
./node_exporter &
& is used to run on the background.
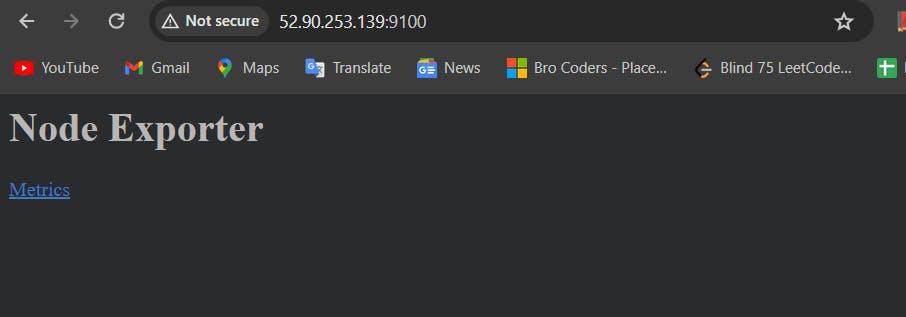
Step 5: Access Node Exporter Metrics
Open your web browser and navigate to the following address:
http://your_server_ip:9100
Make sure you port no. 9100 is added to your security group
Now let's connect the cAdvisor and node exporter with the Prometheus
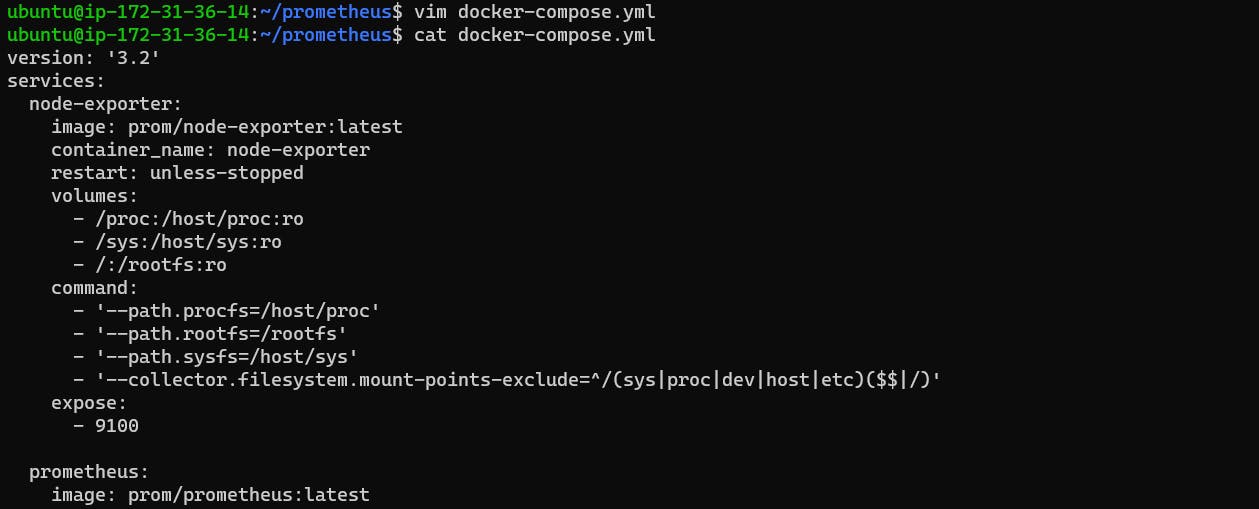
Step 1: change the docker-compose.yml file
version: '3.2'
services:
  node-exporter:
    image: prom/node-exporter:latest
    container_name: node-exporter
    restart: unless-stopped
    volumes:
      - /proc:/host/proc:ro
      - /sys:/host/sys:ro
      - /:/rootfs:ro
    command:
      - '--path.procfs=/host/proc'
      - '--path.rootfs=/rootfs'
      - '--path.sysfs=/host/sys'
      - '--collector.filesystem.mount-points-exclude=^/(sys|proc|dev|host|etc)($$|/)'
    expose:
      - 9100

  prometheus:
    image: prom/prometheus:latest
    container_name: prometheus
    ports:
    - 9090:9090
    command:
    - --config.file=/etc/prometheus/prometheus.yml
    volumes:
    - ./prometheus.yml:/etc/prometheus/prometheus.yml:ro
    depends_on:
    - cadvisor

  cadvisor:
    image: gcr.io/cadvisor/cadvisor:v0.47.2
    container_name: cadvisor
    ports:
    - 8080:8080
    volumes:
    - /:/rootfs:ro
    - /var/run:/var/run:rw
    - /sys:/sys:ro
    - /var/lib/docker/:/var/lib/docker:ro
    devices:
      - /dev/kmsg:/dev/kmsg
    privileged: true
    depends_on:
    - redis

  redis:
    image: redis:latest
    container_name: redis
    ports:
    - 6379:6379
After doing the change do
docker-compose down
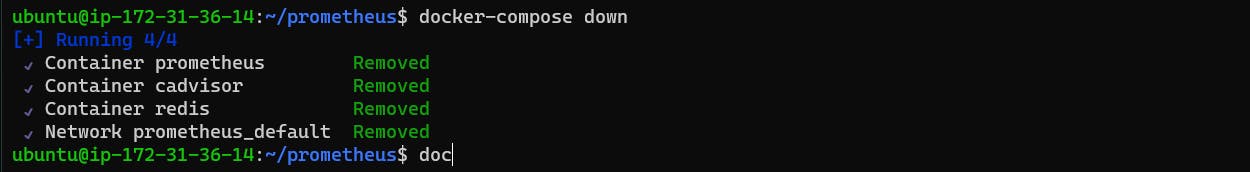
and then restart the service
docker-compose up
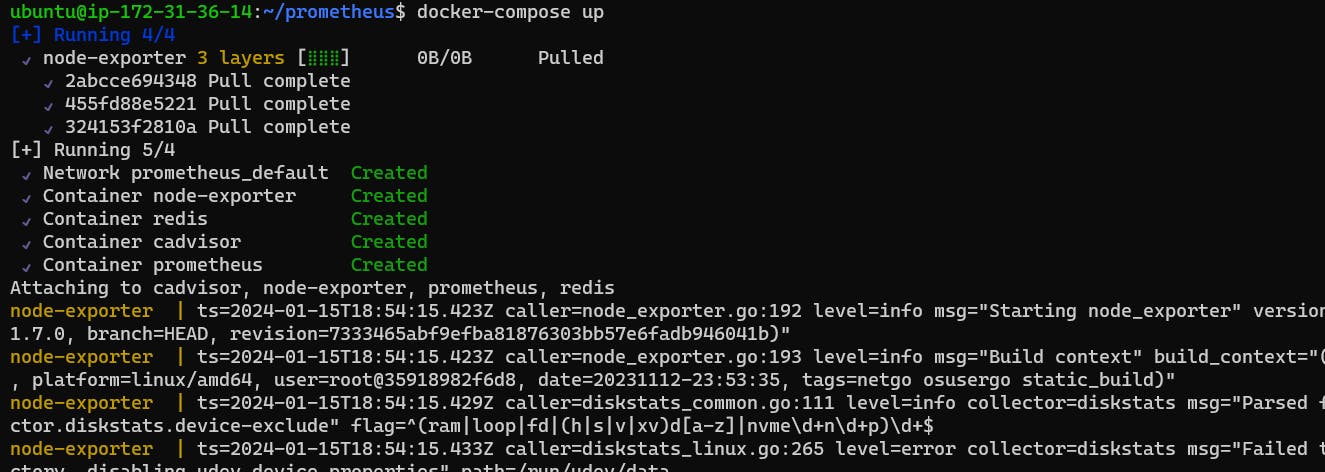
Make sure to wait until the prometheus container made
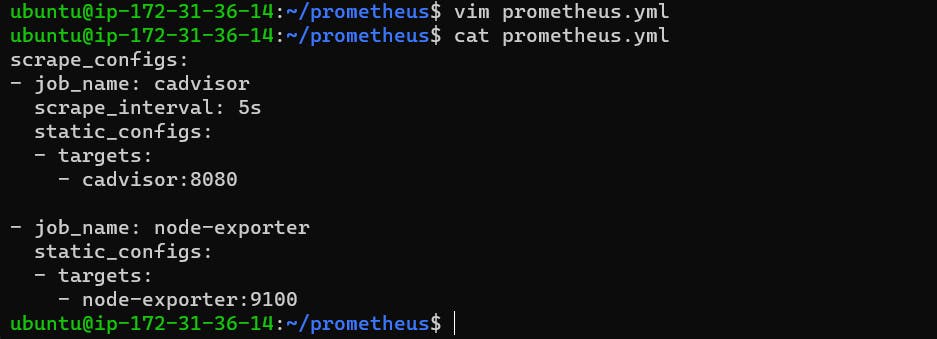
Step 2: change the prometheus.yml file
Above, we created the prometheus.yml file already integrated cAdvisor with the Prometheus
Now let's change the file to integrate the node-exporter with the Prometheus
scrape_configs:
  - job_name: cadvisor
    scrape_interval: 5s
    static_configs:
      - targets:
        - cadvisor:8080

  - job_name: node-exporter
    static_configs:
      - targets:
        - node-exporter:9100
Step 3: Restart the docker container.
docker restart <container_id>
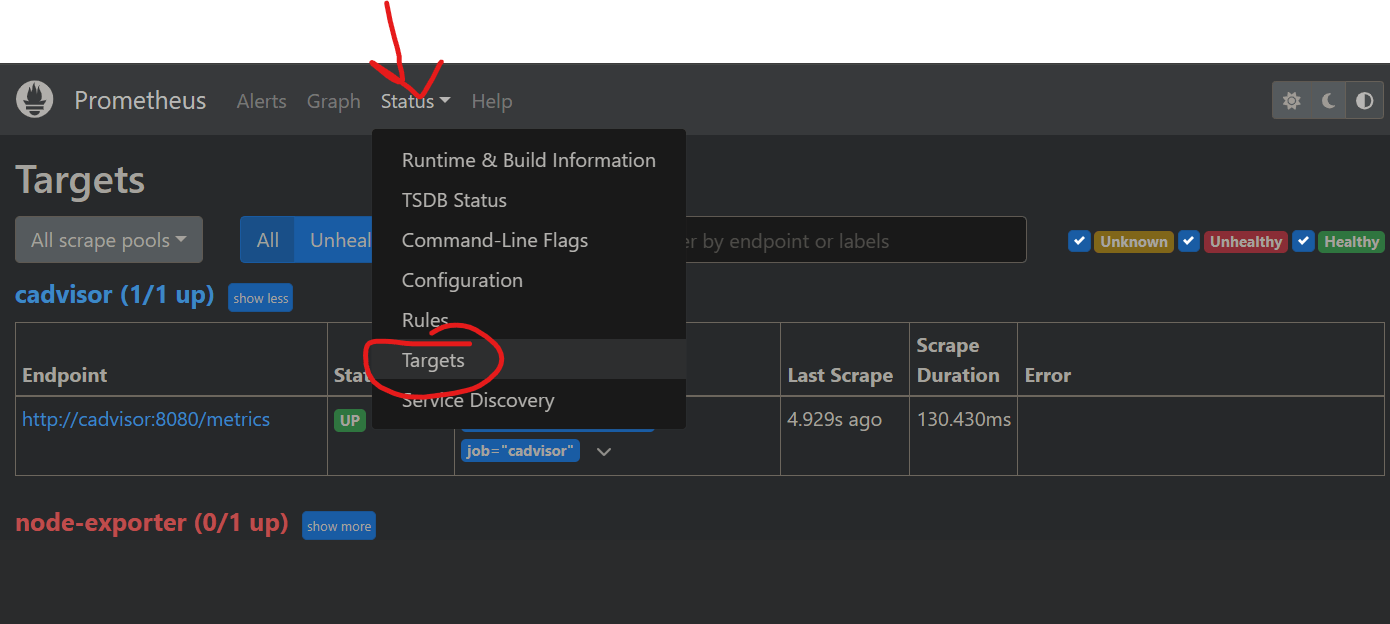
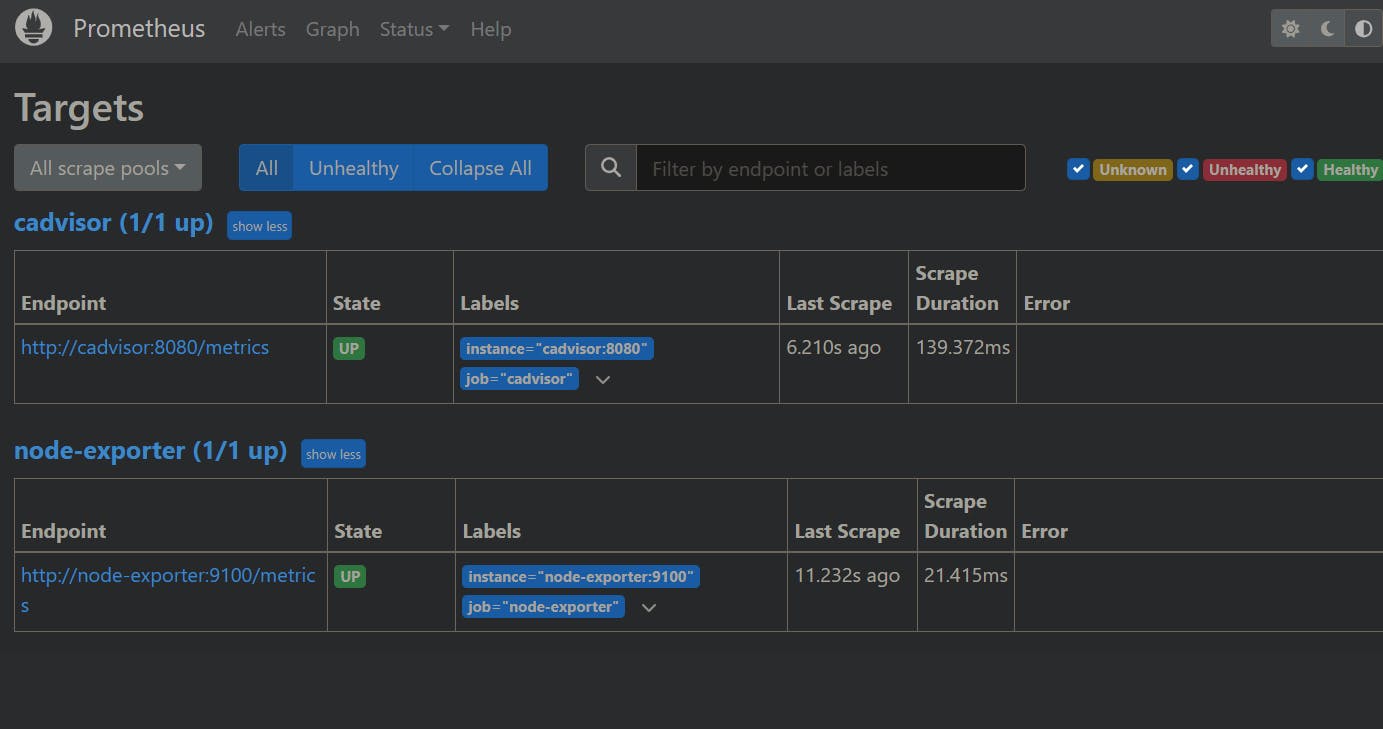
Step 3: Lets check
Simply go to the Prometheus URL and go the status/targets
Conclusion:)
In conclusion, we've successfully orchestrated the installation of Prometheus, cAdvisor, and Redis. This sets the stage for our next blog, where we'll dive into hands-on exploration and harness the full potential of these monitoring tools. Stay tuned for an immersive journey into the heart of containerized monitoring!

Connect with me:)
Thank you for diving into this blog with me! I trust you found the information both helpful and enlightening. To stay updated on the latest in DevOps 🚀, make sure to follow me. Remember, staying informed means staying ahead in the dynamic world of DevOps!
Feel free to connect with me on:
For more updates and engaging discussions on DevOps, let's connect! 🚀 #DevOpsCommunity