Introduction:)
Today, let's embark on a journey into the digital realm with Prometheus, an incredible tool that acts as a guardian for our computer systems. In this exploration, we'll uncover the key features that make Prometheus stand out, understand its architecture, and discover how it ensures the smooth operation of our digital landscapes. Join us as we unravel the magic behind Prometheus and its role in monitoring and maintaining the health of our technological world.
Prometheus

Prometheus refers to an open-source monitoring and alerting toolkit. It is widely used for collecting and analyzing metrics from various software systems. Prometheus helps IT professionals monitor the health and performance of applications, servers, and other components within a computing environment. It enables the detection of issues, performance bottlenecks, and potential problems by allowing users to set up alerts based on predefined thresholds. The software is known for its flexibility, scalability, and ease of integration with different platforms, making it a popular choice for ensuring the reliability and efficiency of IT infrastructures.
Key Features:
Certainly! Here are five of the most important key features of Prometheus:
Metrics Collection:
- Prometheus excels at collecting and storing time-series data, providing a robust framework for monitoring and observing various aspects of systems, applications, and infrastructure.
Alerting:
- The alerting capability in Prometheus allows users to define and set up alerts based on predefined rules. This feature is crucial for proactive issue detection and timely notification of potential problems.
Powerful Query Language (PromQL):
- Prometheus uses PromQL, a powerful query language, enabling users to perform sophisticated queries and aggregations on the collected metrics data. This flexibility is essential for in-depth analysis.
Scalability:
- Designed to be highly scalable, Prometheus can handle monitoring tasks in diverse environments, from small setups to large, distributed systems. This scalability ensures its effectiveness across a range of applications and infrastructures.
Multi-dimensional Data Model:
- Prometheus employs a multi-dimensional data model, allowing data to be tagged with key-value pairs. This feature enhances the ability to filter and query data efficiently, providing a flexible and adaptive monitoring solution.
Architecture of Prometheus Monitoring
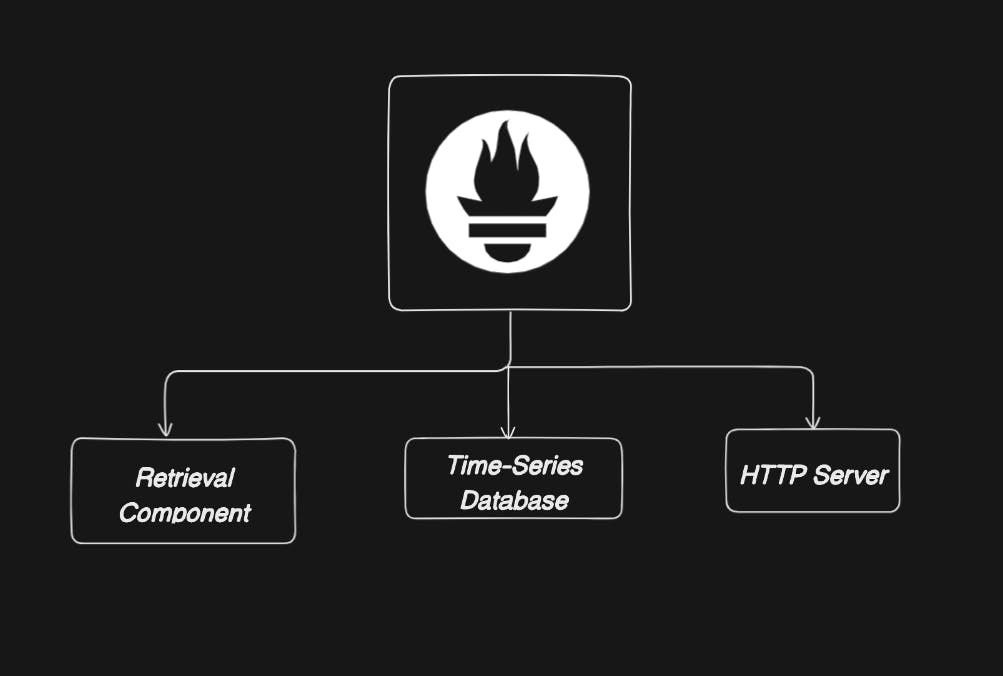
The architecture of Prometheus mainly has 3 components:

Retrieval Component: Responsible for collecting metrics from configured targets using a pull-based model. The Prometheus server periodically queries specified endpoints (targets) to scrape metrics data. This component is crucial for gathering real-time information from the monitored systems.
TSDB (Time-Series Database): Handles the storage and management of the collected metrics efficiently. The TSDB is optimized for time-series data, allowing Prometheus to store and retrieve historical metrics for analysis and visualization.
HTTP Server: Acts as the web interface and API for Prometheus. Users can interact with the Prometheus server through HTTP requests, including querying metrics and visualizing data using PromQL, the Prometheus Query Language. The HTTP server plays a vital role in making monitoring data accessible to users.
What are the Components of Prometheus?
Prometheus Server:
- The central component responsible for collecting, storing, and querying time-series data. It uses a pull-based model to scrape metrics from various configured targets.
Client Libraries:
- Client libraries provide instrumentation for application code, allowing developers to expose custom metrics and integrate applications seamlessly with Prometheus. These libraries are available in various programming languages.
Push Gateway:
- The Push Gateway is a component that facilitates the monitoring of short-lived jobs or batch processes. Instead of having these jobs expose metrics directly, they push their metrics to the Push Gateway, which then makes them available for Prometheus to scrape.
Exporters:
- Exporters are specialized components designed to expose metrics from third-party systems or services that don't natively support Prometheus. Examples include exporters for HAProxy, StatsD, Graphite, databases, and more. These exporters bridge the gap, allowing Prometheus to monitor a wide range of services.
Alertmanager:
- The Alertmanager is responsible for handling alerts generated by Prometheus. It allows users to define alerting rules, group related alerts, silence certain alerts, and route notifications to various channels (email, Slack, etc.). The Alertmanager enhances Prometheus' capabilities for proactive issue detection and response.
What database is used by Prometheus?
Prometheus uses its own custom-built time-series database called the "Prometheus Time Series Database" or simply "Prometheus TSDB." The TSDB is designed specifically for handling time-series data, which is a key aspect of monitoring and observability.
The Prometheus TSDB is optimized for efficient storage and retrieval of time-series metrics data, making it well-suited for the high-write and high-query workload typical of monitoring systems. It plays a central role in storing the metrics collected by the Prometheus server, allowing users to analyze and visualize historical performance data.
What is the default data retention period in Prometheus?
The default period for keeping data in Prometheus is around 15 days. This means Prometheus stores monitoring data for approximately two weeks by default. However, users can adjust this setting based on their storage capacity and data retention preferences by configuring the Prometheus server. Keep in mind that these default values may change, so it's advisable to check the official Prometheus documentation for the latest information.
Conclusion:)
Prometheus is a fantastic tool that keeps our digital world in check. It collects important data, helps us find and fix problems, and ensures our computer systems stay healthy. With its superpowers like metrics collection, alerting, and a cool database
Connect with me:)
Thank you for diving into this blog with me! I trust you found the information both helpful and enlightening. To stay updated on the latest in DevOps 🚀, make sure to follow me. Remember, staying informed means staying ahead in the dynamic world of DevOps!
Feel free to connect with me on:
For more updates and engaging discussions on DevOps, let's connect! 🚀 #DevOpsCommunity

