Monitoring with Grafana Cloud: EC2 Alerts & AWS Billing
#Day77 of #90DaysOfDevOps
Introduction:
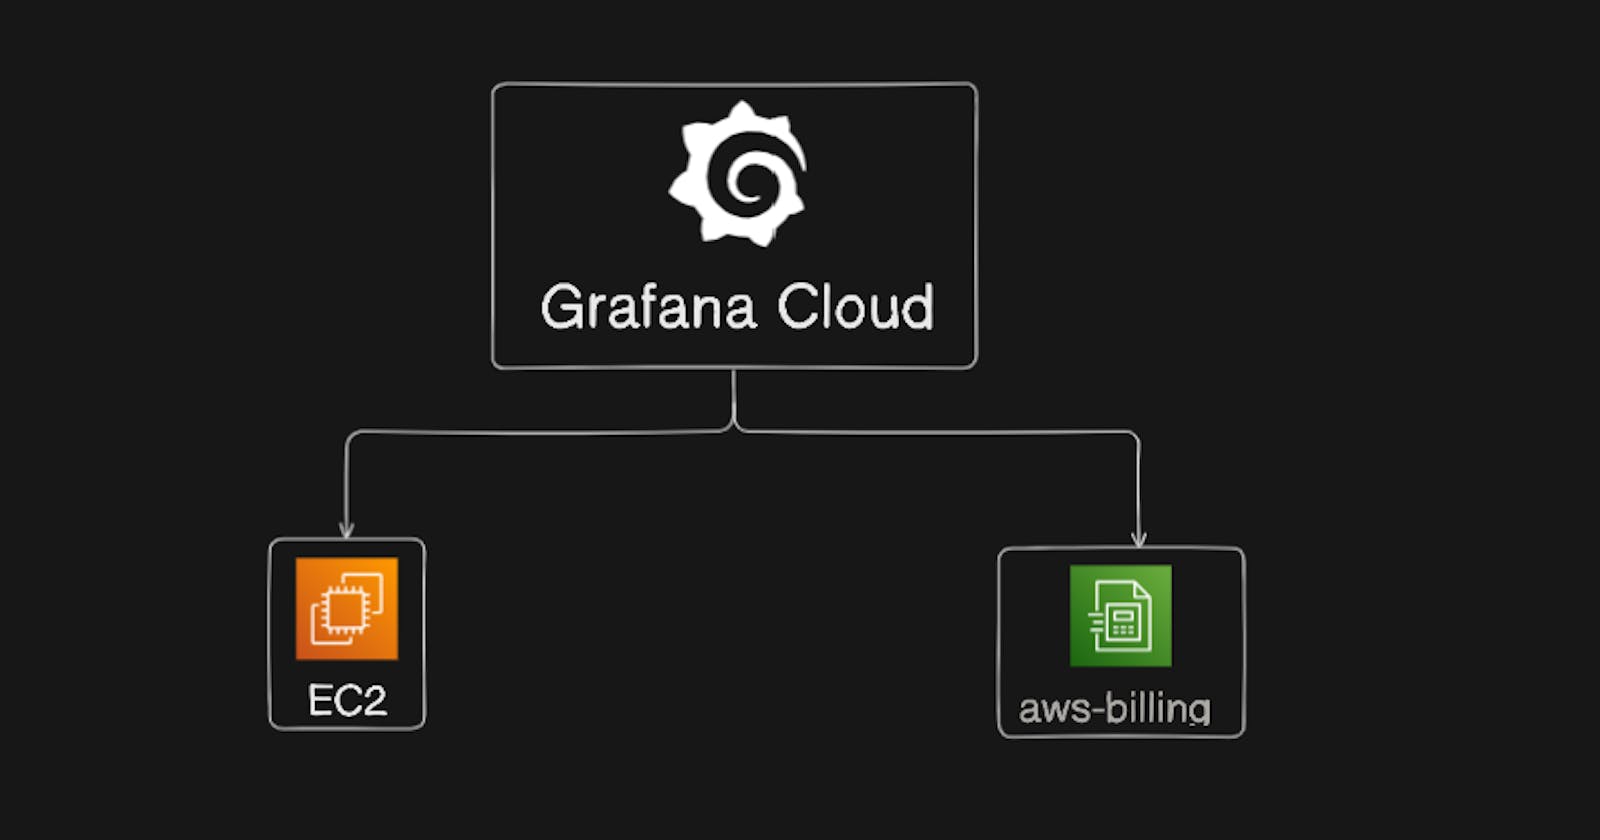
In today's DevOps journey, we dive into the powerful capabilities of Grafana Cloud for efficient monitoring and alerting. Specifically, we'll focus on setting up alerts for EC2 instances and AWS billing, ensuring proactive management of resources and costs. Join me in unraveling the steps to enhance your cloud observability with Grafana Cloud's robust features.
What is Grafana Cloud?

Grafana Cloud is a comprehensive observability platform that empowers organizations to monitor and visualize their infrastructure, applications, and logs effectively. It is a cloud-based service built on the popular open-source Grafana platform, offering a range of features for robust observability and proactive incident management.
Key aspects of Grafana Cloud include:
Unified Monitoring: Grafana Cloud allows users to consolidate their monitoring efforts by providing a unified platform to visualize metrics, logs, and traces.
Grafana Dashboards: Users can create interactive and customizable dashboards, making it easy to visualize and analyze data from various sources.
Alerting and Notifications: The platform enables users to set up alerting rules based on specific conditions and receive notifications through various channels, ensuring timely responses to potential issues.
Data Sources: Grafana Cloud supports integration with various data sources, including popular databases, cloud providers, and more, allowing users to aggregate data from diverse environments.
Loki for Logs: Grafana Cloud includes Loki, a log aggregation system that helps users explore, analyze, and visualize log data efficiently.
Prometheus as a Service: Prometheus, a widely-used monitoring and alerting toolkit, is available as a service in Grafana Cloud, simplifying the setup and maintenance of Prometheus instances.
Tracing with Jaeger: Grafana Cloud integrates with Jaeger for distributed tracing, providing insights into application performance and dependencies.
Cloud-Native Observability: With features like AWS CloudWatch integration, Grafana Cloud is well-suited for monitoring cloud-native applications and infrastructure.
Scalability and Reliability: Grafana Cloud is designed to scale with the user's needs, providing a reliable and high-performance observability solution.
Usage-Based Pricing: The platform typically follows a usage-based pricing model, allowing organizations to pay for the resources they consume, making it cost-effective
Task 01: Setup Alerts for EC2 Instances
Step 1: Configure AWS Data Source in Grafana
Log in to your Grafana Cloud account.


Navigate to
"Connections" > "Add new connection".
Choose "Amazon Web Services (CloudWatch)" from the list.


Now add the new scrape job

Create a new AWS role: make this as it is and just click on the launch stack

Simply Log in to your AWS account
After login you see
Quick create stack. Simply create the stack.
Tick the acknowledge:

Note : It take little time to created stack.
Copy the ARN

Paste the copied arn in the grafana cloud
Note: you have to give the job name , arn and aws region


Step 2: Choose and configure the service
Select the service form the listed

Configure the service

Step 3: Create a Dashboard for EC2 Alerts
Simple choose
install dashboard and alerts

View dashboard and choose the Ec2 service

Task 02: Setup AWS Billing Alerts
Step 1: Configure AWS Billing Data Source in Grafana
Follow similar steps as in Task 01 to add a new data source for AWS Billing.
Choose "Amazon Web Services (CloudWatch)" and configure the AWS credentials and region.
Step 2: Create a Dashboard for Billing Alerts
Create a new Grafana dashboard or use an existing one.
( I use the existing one )

Edit this job

Add new service from the service list.

choose aws/billing and save it

Step 3: Save the job

Step 4: view the dashboard
At the top click on the view dashboard

choose the aws/billing from the list


Now save the bill 🙂🙂
Delete the stack from AWS to avoid billing.

Delete the dashboard and Uninstall the integration from Grafana cloud


Conclusion:
In summary, configuring alerts for EC2 instances and AWS billing in Grafana Cloud involves setting up AWS data sources, launching stacks, and creating dashboards. The process for EC2 alerts includes creating an AWS role, acknowledging stack creation, and configuring the service. Billing alerts require setting up a billing data source, creating/editing a dashboard, and viewing billing details. Both tasks stress the need for precise configuration to ensure robust monitoring and alerting. Don't forget to delete unnecessary stacks and dashboards to avoid unintended billing.
Connect with me:)
Thank you for diving into this blog with me! I trust you found the information both helpful and enlightening. To stay updated on the latest in DevOps 🚀, make sure to follow me. Remember, staying informed means staying ahead in the dynamic world of DevOps!
Feel free to connect with me on:
For more updates and engaging discussions on DevOps, let's connect! 🚀 #DevOpsCommunity

