Grafana Alerting: Easy Steps to Proactive Data Monitoring
#day76 of #90daysofdevops

Introduction:
Welcome to the world of Grafana Alerting! In this blog, we'll delve into the capabilities of Grafana's alerting feature, a powerful tool that acts as a vigilant guardian for your data.
Grafana Alerting
Grafana Alerting is a feature within the Grafana platform that allows users to set up and manage alerts based on specific conditions or thresholds in their monitoring data.
Grafana Alerting is like a watchful guardian for your data. It helps you set up warnings, so when something important happens, like a sudden spike or drop in numbers, Grafana will notify you right away. This way, you can stay on top of any issues and keep your systems running smoothly.
key features of Grafana alerting
Here are the key features of Grafana Alerting:
Threshold-based Alerts:
- Define alert rules based on specific conditions or thresholds in your time-series data.
Flexible Queries:
- Use flexible queries and aggregations to create complex conditions based on your data.
Alert States:
- Distinguish between different states of alerts, including OK, Pending, and Alerting, for clear status understanding.
Notification Channels:
- Configure multiple notification channels, such as email, Slack, PagerDuty, etc., for alert delivery.
Silencing Rules:
- Create silencing rules to temporarily suppress alerts during planned maintenance or issue resolution.
Dashboard Integration:
- Seamlessly integrate alerts into Grafana dashboards for a unified monitoring experience.
Historical Data:
- Retain the history of alerting data, allowing for review and analysis of past alert events.
Annotations:
- Add annotations to graphs and dashboards when an alert fires to provide context for post-incident analysis.
How does alerting work in Grafana?
  +--------------+
  |  Start       |
  +--------------+
         |
         v
  +------------------------+
  | Define Alert Rules     |
  +------------------------+
         |
         v
  +------------------------+
  |   Query Data           |
  +------------------------+
         |
         v
  +------------------------+
  | Evaluate Conditions    |
  +------------------------+
         |
         v
  +------------------------+
  | Alert State Determination|
  +------------------------+
         |
         v
  +----------------------------+
  | State Changes Trigger Notifications |
  +----------------------------+
         |
         v
  +------------------------+
  | Notification Channels  |
  +------------------------+
         |
         v
  +------------------------+
  | User Acknowledgment    |
  +------------------------+
         |
         v
  +------------------------+
  | Dashboard Integration  |
  +------------------------+
         |
         v
  +------------------------+
  | Historical Data and Annotations |
  +------------------------+
         |
         v
  +--------------+
  |    End       |
  +--------------+

Setting up Alert Rules:
- Users define rules specifying conditions or thresholds based on their monitoring metrics.
Querying Data:
- Grafana continuously queries the data source (e.g., Prometheus, InfluxDB) to retrieve the latest metrics.
Evaluating Conditions:
- The retrieved data is compared against the defined conditions in the alert rules.
Alert State Determination:
- Grafana calculates the current state of the alert, such as OK, Pending, or Alerting, based on the evaluation.
State Changes Trigger Notifications:
- When the alert state changes (e.g., from OK to Alerting), Grafana triggers notifications.
Notification Channels:
- Grafana sends alerts through configured notification channels (e.g., email, Slack, PagerDuty) to notify users or external systems.
User Acknowledgment:
- Users acknowledge the alert and take necessary actions, such as investigating the issue or performing corrective measures.
Silencing Rules (Optional):
- Users may set up silencing rules to temporarily suppress alerts during planned maintenance or known issue resolution.
Dashboard Integration:
- Alerts are seamlessly integrated into Grafana dashboards, allowing users to visualize and analyze alert data alongside their monitoring metrics.
Historical Data and Annotations:
- Grafana stores historical alert data, providing users with the ability to review past incidents. Annotations can be added to dashboards when alerts fire, providing additional context.
Tasks:
Task-01: Set up the grafana cloud
Certainly! Here's a concise summary of the steps to set up Grafana Cloud:
Step 1: Sign Up for Grafana Cloud
Visit the Grafana Cloud website.
Click on "Get Started for Free" or "Sign Up" to create a new account.

Fill in the required information to create your account.
Step 2: Choose a Plan
After signing up, log in to your Grafana Cloud account.
Choose a plan based on your requirements.
Step 3: Create a New Organization
Once you've selected a plan, create a new organization.
Enter the organization details, such as the organization name.


Task 2: Configure Error Alerting in Grafana
Step-01: Access the Alerting Section
Go to the Grafana Dashboard.
Click on the "Alerting" option.

Step-02: Add Data Source
In the Alerting section, locate "Alert Rules."

Add the data source, selecting the one configured in the previous blog (Loki-1).
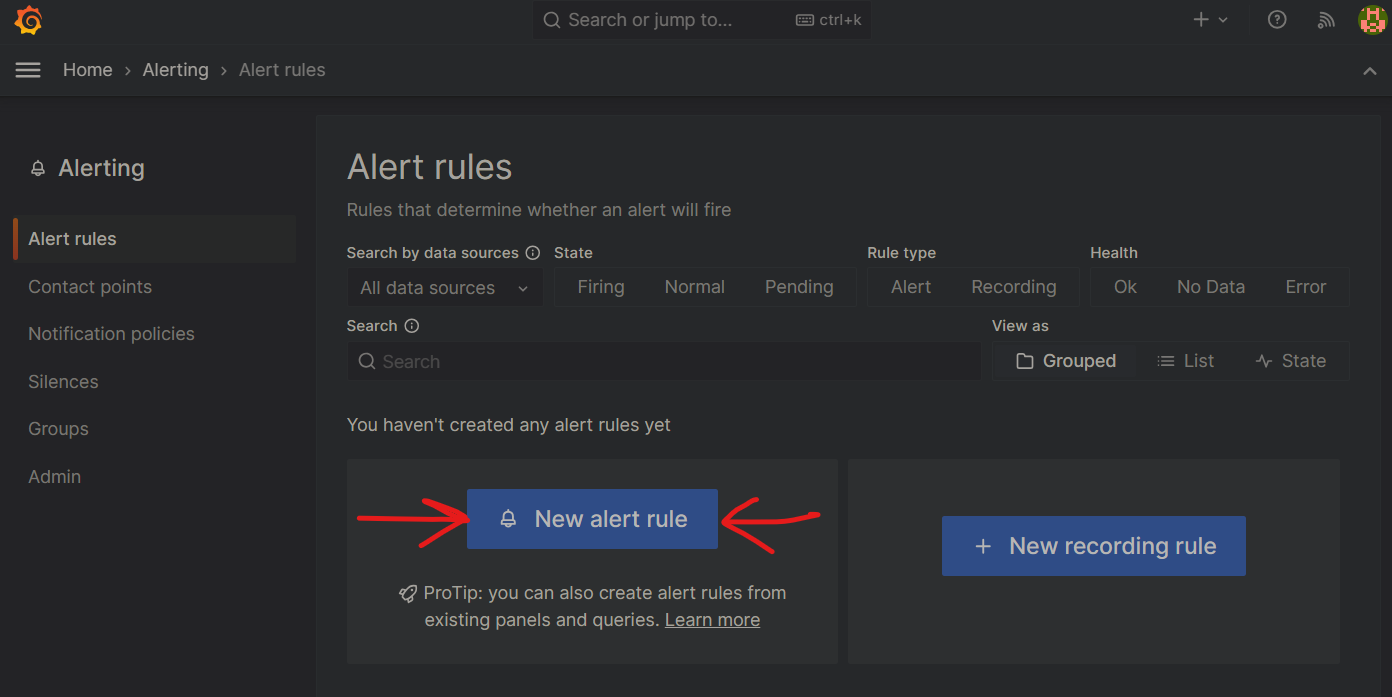
Step-03: Create New Alert Rule
Click on "New Alert Rule" to create a new rule, e.g., Error Alerting.

Additional rules like Warning and Critical can be added.
Step-04: Define Query
Define the query for Error Alerting. Reuse the query from the previous blog (Loki-1).

Step-05: Set Evaluation Behavior
Set the Evaluation Behavior, storing the Rule State.
Configure the Evaluation Delay to 5 minutes.


Step-06: Configure Annotations and Notifications
Keep Annotations and Notifications as default.
Click on "Save" to save the Error Alerting configuration.

Conclusion
The Error Alerting is now successfully configured in Grafana.
The system will generate Error Alerting reports every 5 minutes, following the set Evaluation Delay.


Summary:
Grafana Alerting is like having a watchful eye on your data. You set up rules to say, "Hey, alert me if something important happens!" It keeps checking your data, and if it sees something you specified, it sends you a notification, like a message or email. You acknowledge the alert and can see it on your Grafana dashboard, helping you catch and fix issues quickly. It's like a smart helper keeping you in the loop about what's happening with your data.


